Proof of concept speed optimizations get fcp to 1s
Ticket from Jira https://powrtrak.atlassian.net/browse/MAR-852
mr - https://gitlab.com/powr/powr/-/merge_requests/4392
The First Contentful Paint (FCP) is one of the big parts of optimization stuff - https://web.dev/fcp/. In this article, I tried to collect/group all information and apply it to our app.
For this particular ticket, I checked tutorial pages on desktop and mobile devices through the Lighthouse application which gives you some opportunities to evaluate site performance. More is here: Lighthouse
Test specs:
- Test env - development
- Tutorial page - https://3b28e5bd.ngrok.io/tutorials/how-to-add-form-builder-plugin-to-your-html-site
- Tool of performance - Lighthouse
The performance can be a little bit incorrect because tests went through ngrok it makes some delays between your machine and the audits tool
First test without optimization
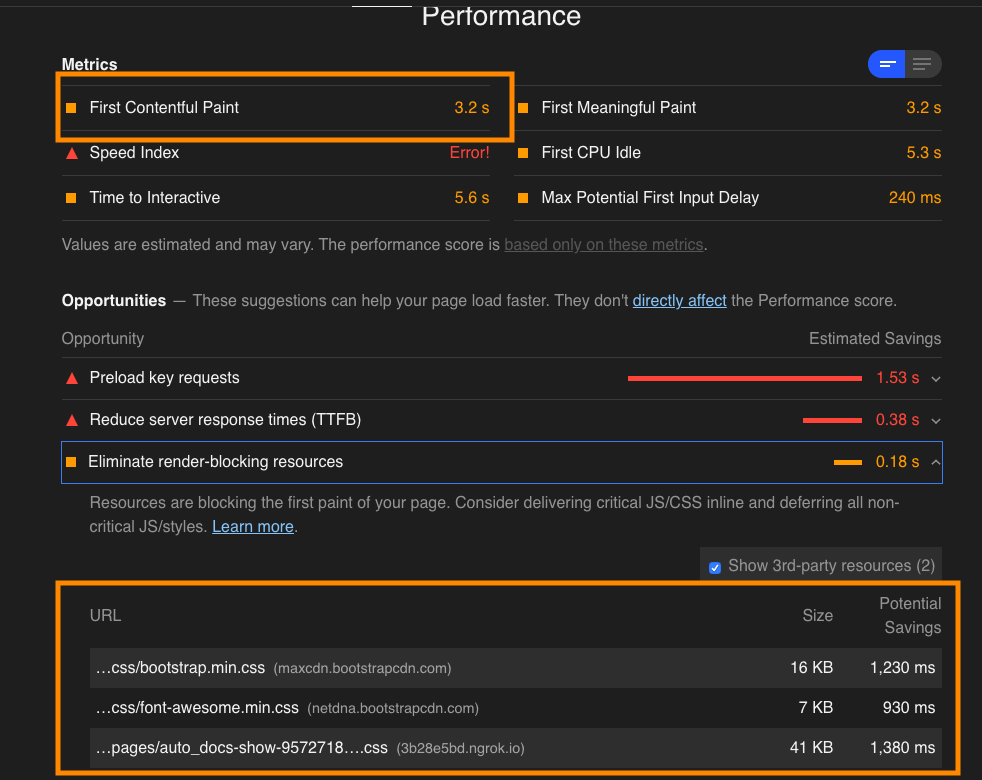 By the first test we got 3.2s before showing the first content and we have three files whick block our content
How to eliminate render-blocking resources? Pretty good docs are here - https://web.dev/render-blocking-resources/ ,
Briefly the whole blocked content we have inside application.html.haml So by the specs and performance report we definitely know where are they
For the JS third libraries we could set additional attributes for async loading:
%script{src:'//ajax.googleapis.com/ajax/libs/jquery/1.11.2/jquery.min.js', async:true, defer:true}
For the CSS it's more complicated because it doesn't know about async attribute and for async loading we should change tag attrs as well:
= stylesheet_link_tag "vendors/bootstrap.min.css", :rel => "preload", :as => "style", :onload =>"this.onload=null;this.rel='stylesheet'"
Also google suggests to split into critical and not-critical styles -> https://web.dev/defer-non-critical-css/. But I didn't do it because it looks like we need to wait when we move our sass builder outside to webpack(as I know Yerassyl are working it on)
The whole listing here - branch name MAR-852_speed_optimizations_p_and_c
Second test after the loading third party libraries asynchronously
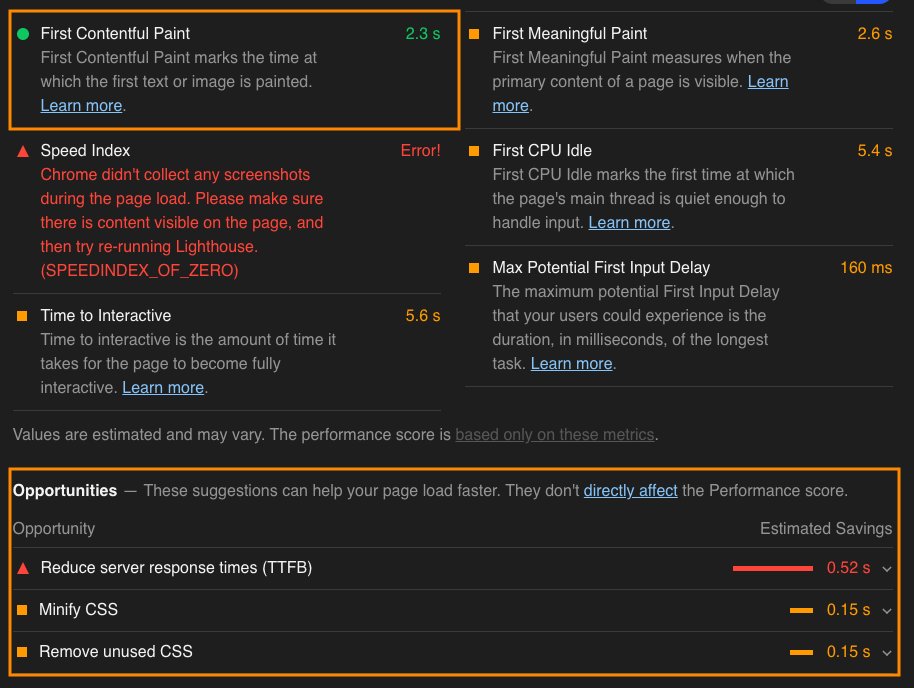
I've used this audit tool a bunch of time and got on average 1s performance(2.3s FCP on the screen). Also we could get less time to load if it hadn't been a local machine - not minifyde css and long latency(bottom rect)