🔥 Fire - What to do when server is down or slow
Step 1: Take a deep breath. Oxygen is necessary to make good decisions.
Step 2: Is this a fire? Verify
Some common things reported by support
- Chunk not loading
- Users/me not loading for user x - Does this load for you and qa? May be just a user related issue?
- How many users are affected by this? eg: Forms are not submitting - Fire Standalone is not loading - Fire Users/me for a single user not loading - not fire Japanese Yen is not working - not fire 1 simple copy is missing - not fire All simple copies missing - Fire Paypal not accepting payments - Fire Instagram feed is down again - Fire
Step 3: Start a google meet in fire channel and alert all engineers that are online.
quick meet link: meet.google.com/asz-scvc-faf
or type in start fire call
Step 4: Diagnose Issue
*NOTE: If the team is not able to identify the issue in ~10 minutes and the server is down or unusable, call Ben (+1 610 737 3935) or Puru (628 333-5557). Contact info for other POWr rangers is here
Open Dashboards:
- Open heroku (https://dashboard.heroku.com/apps) and especially new relic
- May be useful to see the live logs
heroku run logs -t -a powr - Did we recently make any pushes that correspond with the error?
Lots of timeouts in the logs and high request queuing in new relic => determine if issue is a specific endpoint or an underlying resource such as postgres, redis, or memory being overwhelmed.
Specific Endpoint Problems
Look at transactions in the lower left of new relic screen and click on any that are taking a long time to see if they are directly correlating with when the server is slow.
If a specific endpoint is causing problems:
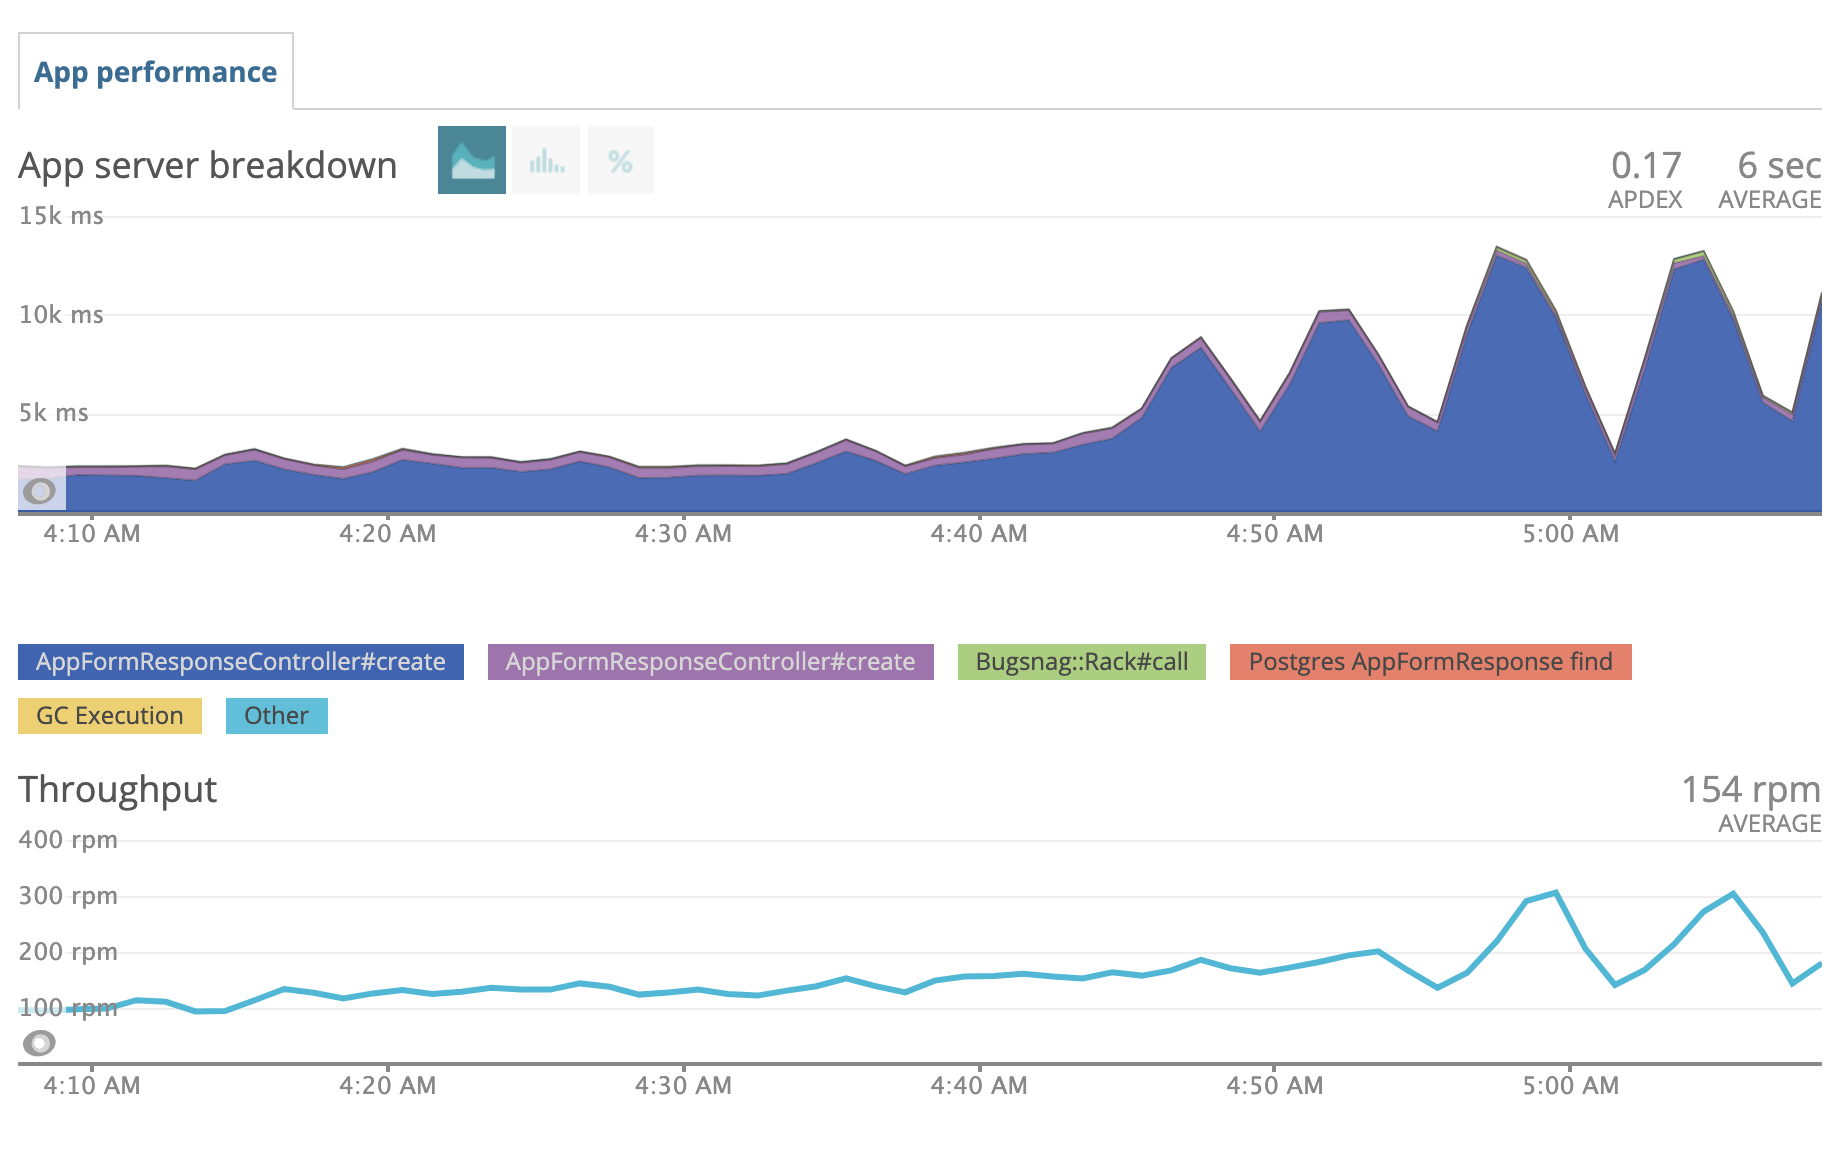 ^ throughput of app form response goes up at same time as server response time => there's your problem
- Immediately increase the dynos: https://powr.gitlab.io/docs/engineering/89
- Find out if a specific user or app is getting spammed. Eg for form responses
AppFormResponse.where('created_at > ?',5.minutes.ago).group(:app_id).count. Figure out how to stop them. - Be aware you can quickly block an IP address is cloudflare: https://powr.gitlab.io/docs/engineering/269.
Underlying Resource Problems
- Is memory high? https://dashboard.heroku.com/apps/powr/metrics/web
- Go to Heroku => POWr => Metrics. Look at Memory Usage:

- Does postgres DB have problems?*
- Look at currently running queries:
heroku pg:ps - Look at current DB connections from heroku dashboard. If over 400, kill all connections
heroku pg:killall - Use built in diagnostic command:
heroku pg:diagnose
- Look at currently running queries:

Diagnosing sidekiq issues
- Visit: https://www.powr.io/sidekiq
- Are there busy workers that have been taking minutes to hours to run? (Generally, only admin workers should take this long)
- STOP the workers in the /sidekiq interface.
- If DB is still slow, you may need to Reset DB Connections (see below)
- Figure out what code is causing these to take too long
- Is enqueued list > 10,000?
- Are busy workers slow? See previous bullet.
- Is the same task duplicated many times?
- Eg:
heroku ps:stop web:32 -a powrin this case. - You can find and delete the specific tasks via console: https://www.getoutline.com/doc/deleting-stuff-in-sidekiq-iK7Uqk9Xa7
- Is code allowing the same task to get called many times? Fix it.
- Is a user spamming us? TODO: HOW TO BLOCK SPAMMING USERS
- Eg:
- Are workers not running at all? Visit heroku and see how many instances are running. Increase if necessary (usually up to 10 workers).
Diagnosing REDIS issues
There are few ways you can diagnose redis issues
New Relic
Select specific Controller#action with higher response time on new relic
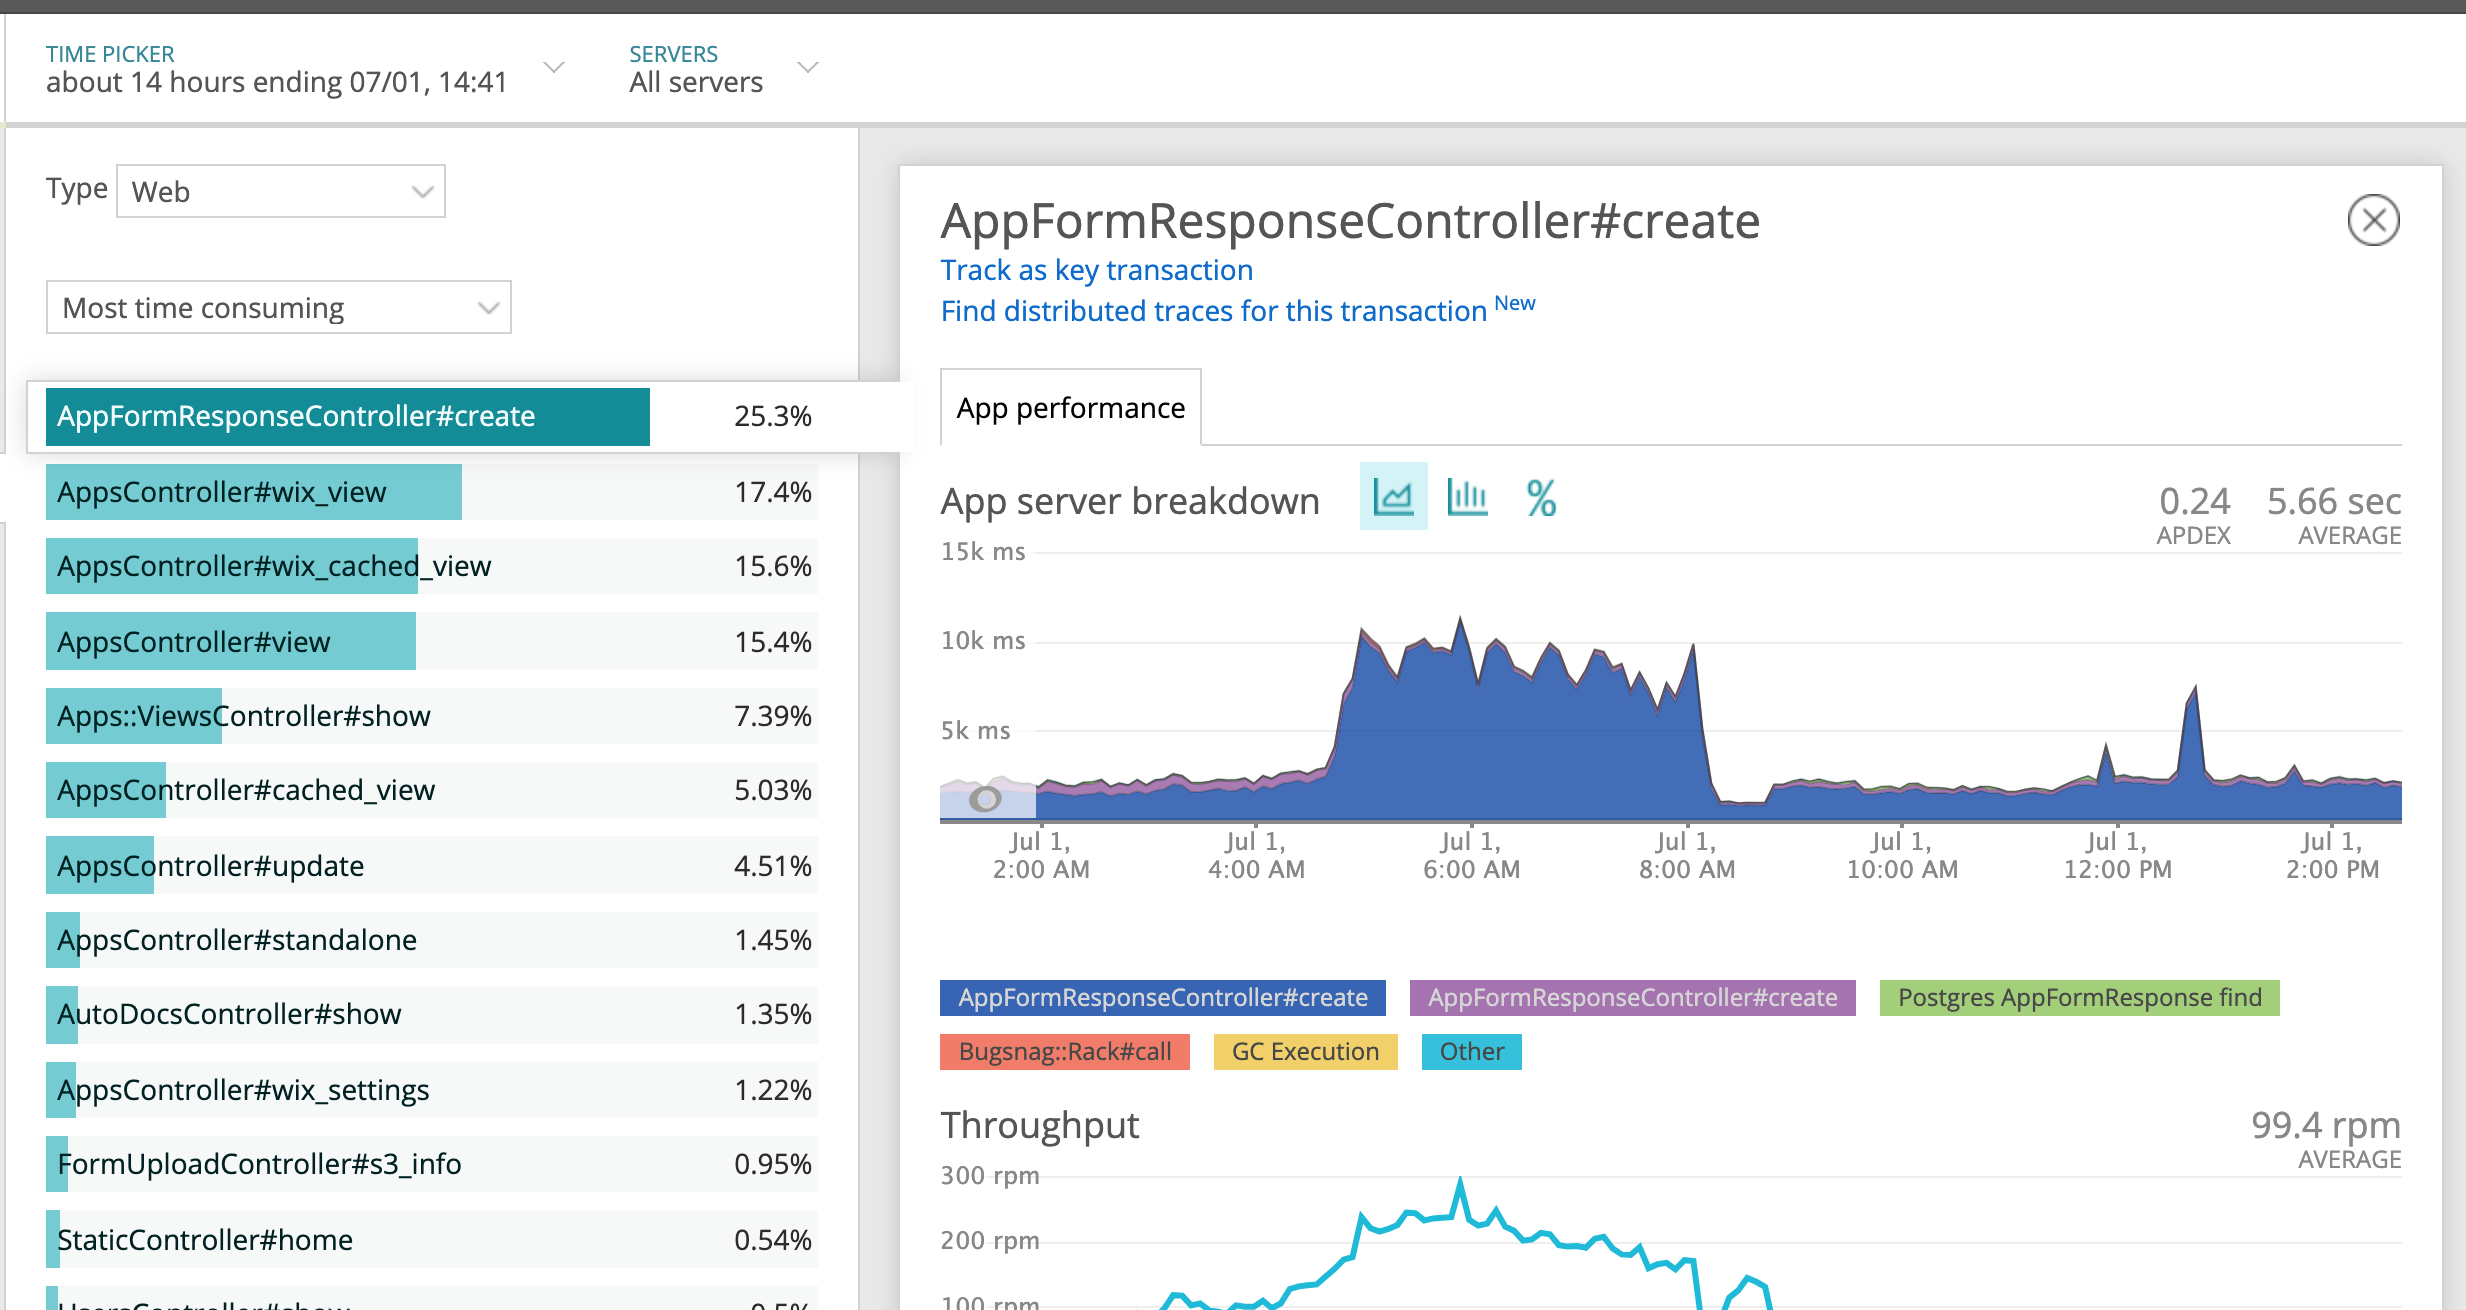
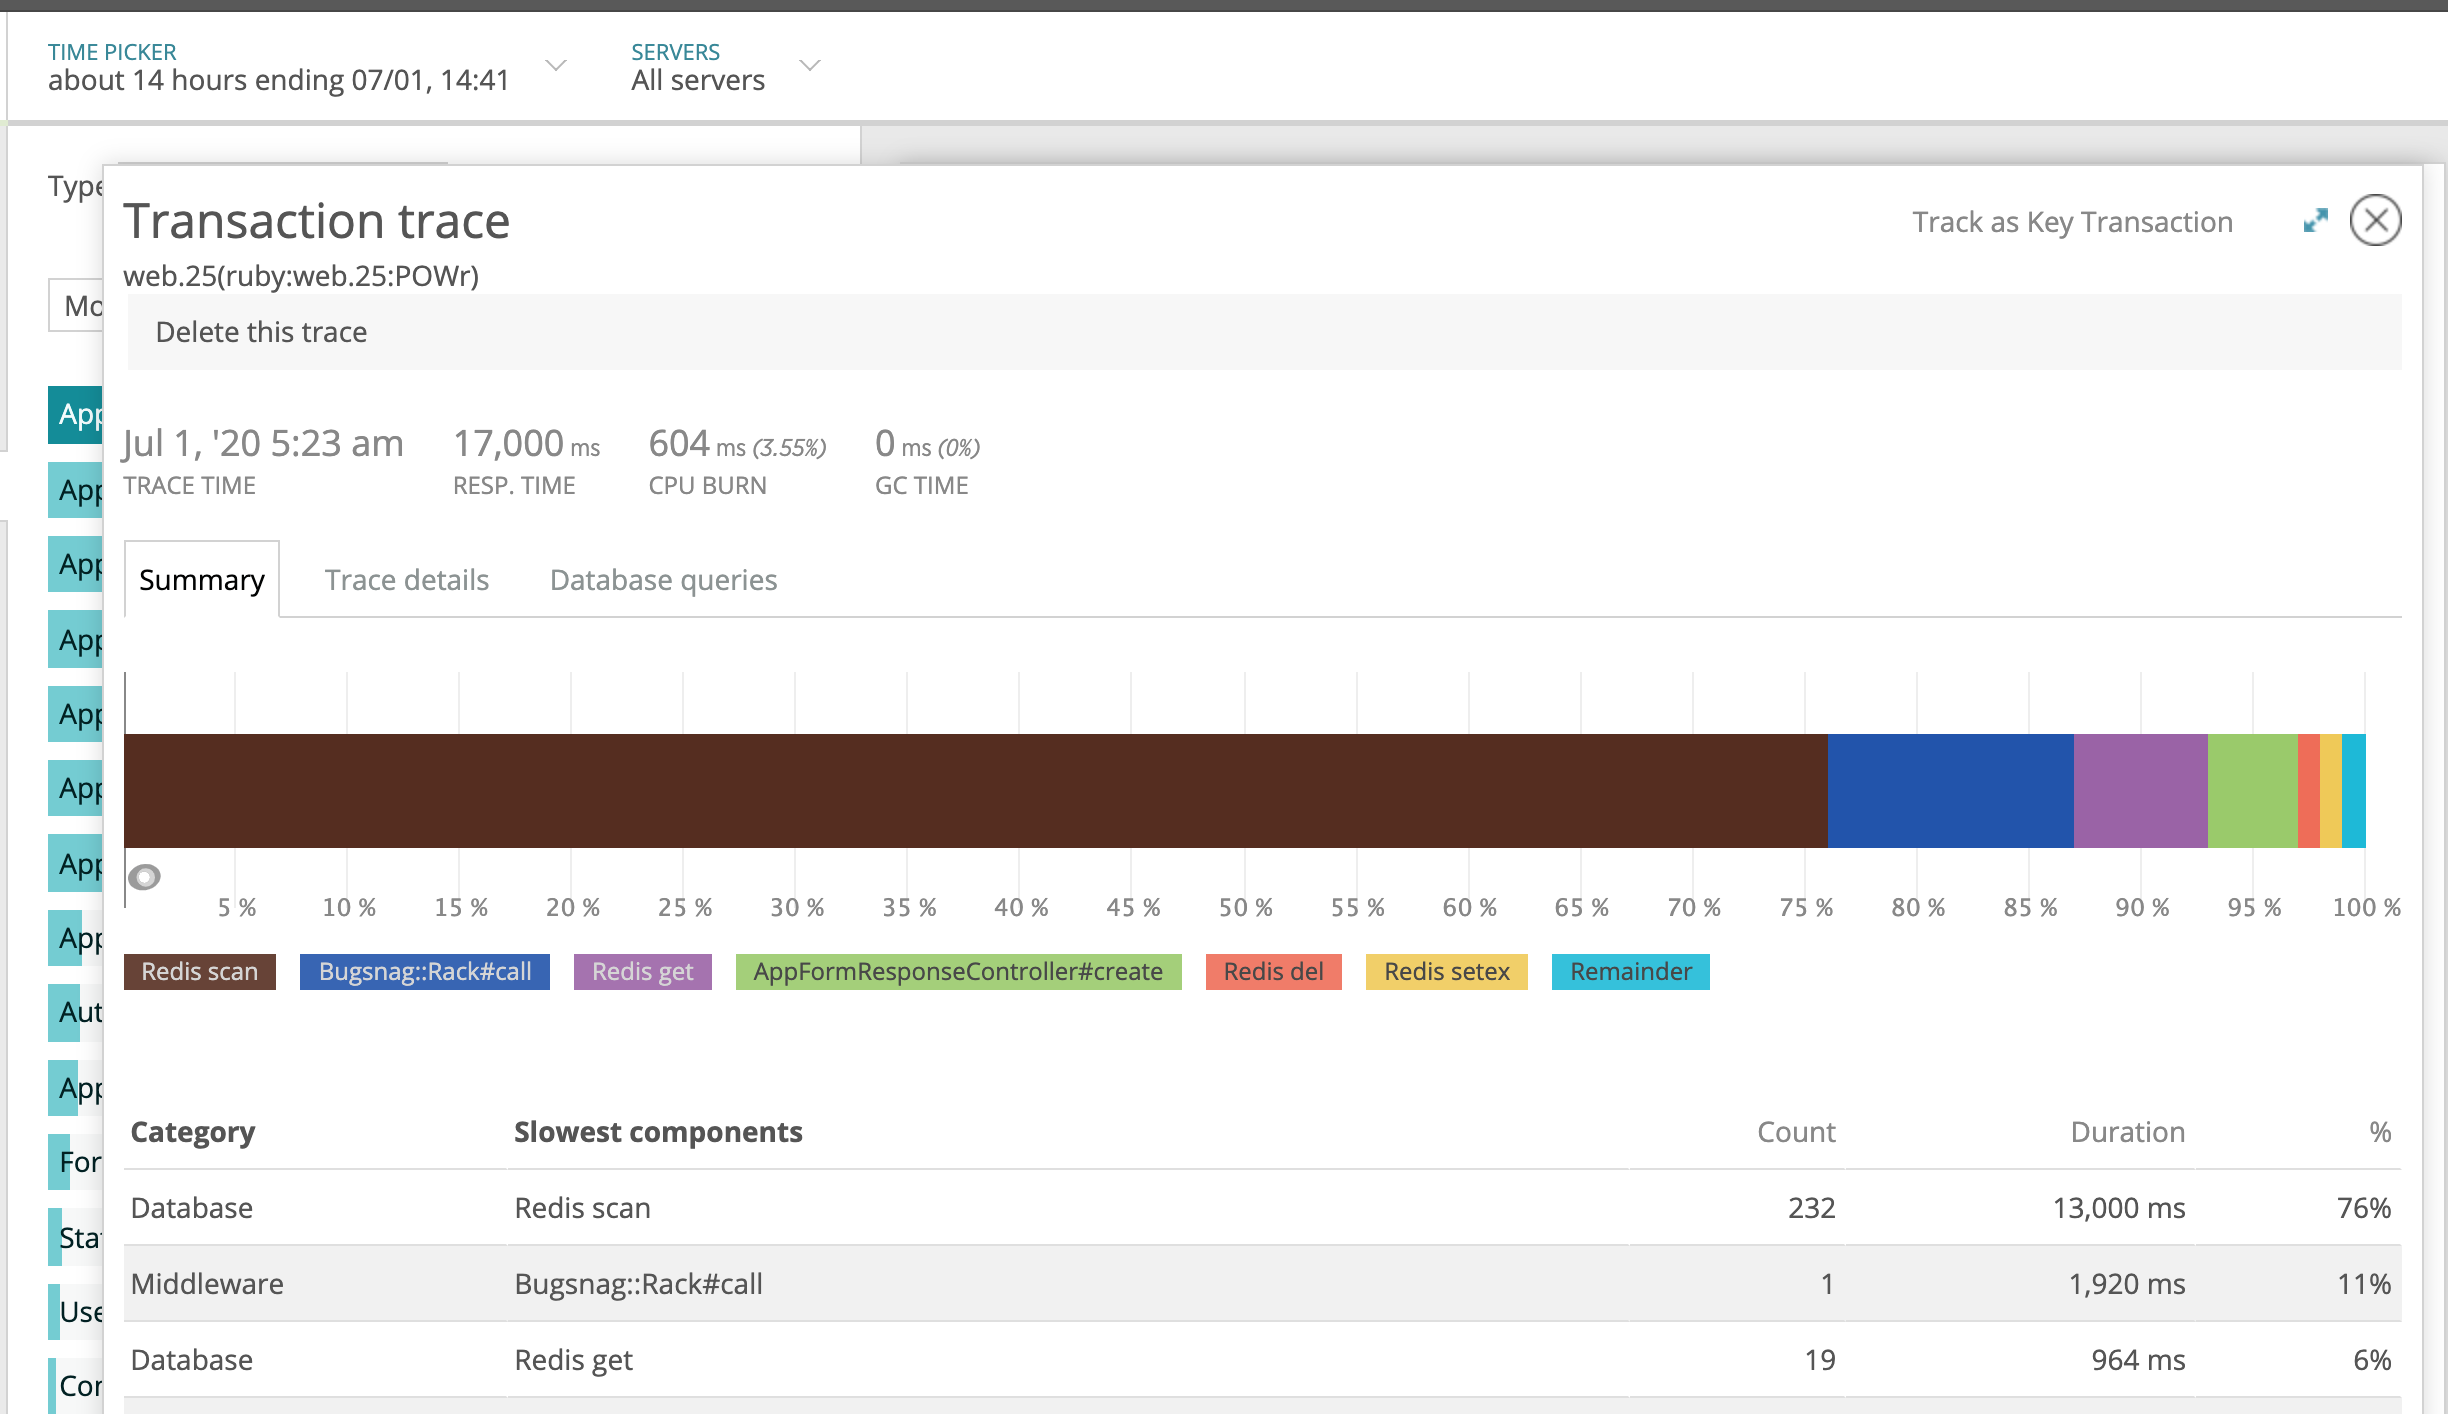
Scroll to the bottom of the page and locate Application Trace, click on one of those endpoint on the table, you will see something like this. If an endpoint has higher Redis Scan, this means there usually is way too many redis cache being accessed, Simple Copies, General Copies for example.
Scout APM
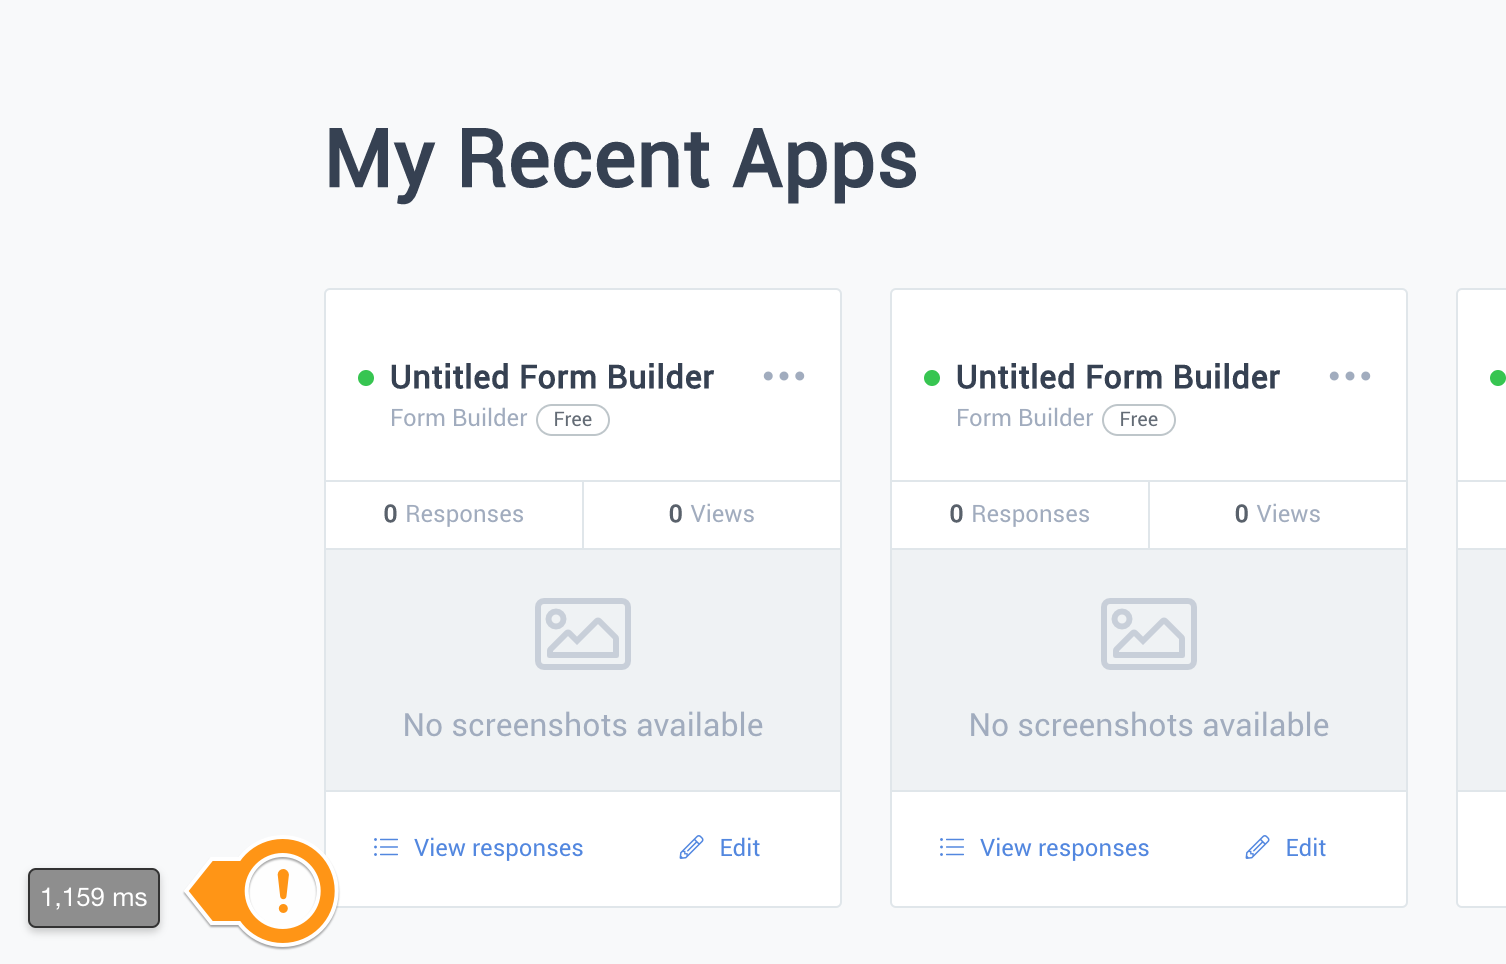
- Our development server already comes with Scout APM preinstalled and you can find a little tool tip towards left hand side corner of the page.

- Click on it and select the Controller#action with higher response time, it usually will show you number of redis get/set calls
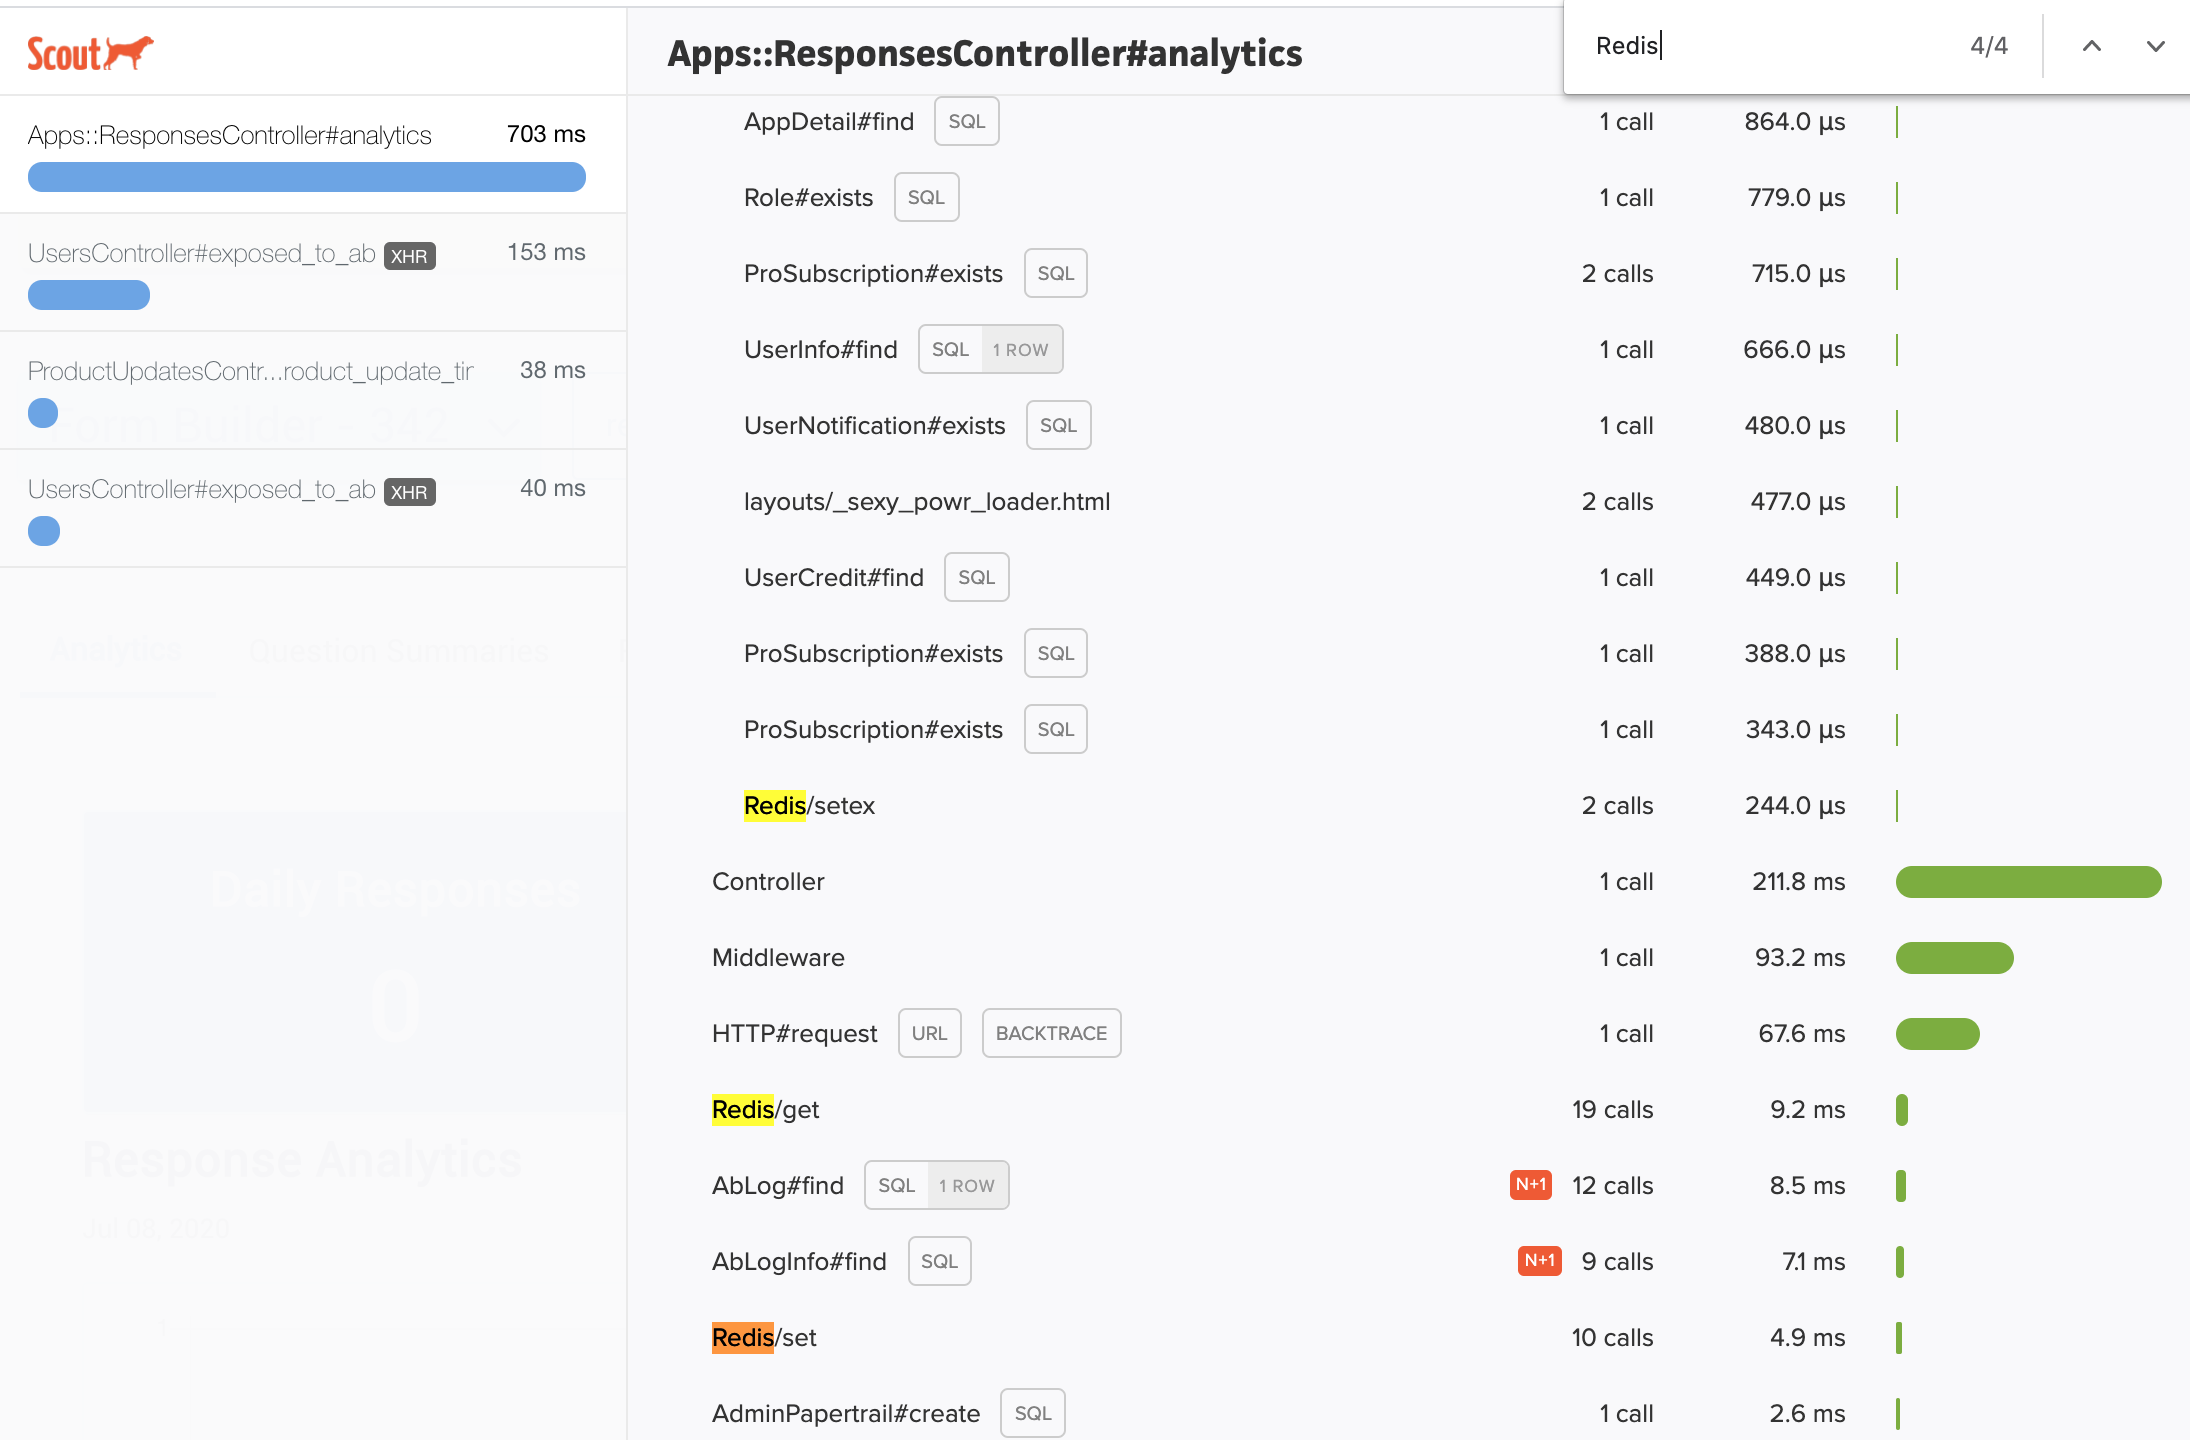
*Why is this a problem? Well, redis is hosted on external server, even though redis is a good thing to have, if we are making 100's of redis queries, 100 different times, it has to connect to remote server and each of these will add up, instead we should combine all the keys we would like to check and make just one query.
Step 4: Action
Server Rollback Procedure Is a major part of the site crashed or unusable?
- YES => Instant rollback (see https://www.getoutline.com/doc/install-rollback-how-to-rollback-heroku-with-0-downtime-qtl91V6zdS)
heroku features:disable -a powr prebootheroku rollback -a powrheroku features:enable -a powr preboot
- NO => Normal rollback:
heroku rollback -a powr
https://dashboard.heroku.com/apps/powr/activity
Reset DB Connections Are specific connections taking a super long time to run?
- Find slow DB connections via
heroku pg:ps - Kill specific connections using
heroku pg:kill PROCESS_ID, where PROCESS_ID is found from previous step.
Are there too many connections? Or zero connections?
- Kill ALL connections:
heroku pg:killall
Step 5: Documentation
- Alert fire channel with the progress and resolution of the issue
- Move non-fire communications out of the channel
- Create a fire doc with the details of what was discovered so people in other timezones can pick up where you left off